For more than three years, at DZD (Deutsches Zentrum für Diabetesforschung), the German Centre for Diabetes Research, we have been using graph software to help our main research mission, looking at diabetes. Now, we are using the same software to build a new knowledge graph to help fight COVID-19.
At the DZD we’ve been collaborating with data management software and services firms Kaiser & Preusse, yWorks, ProDyna, Structr, Neo4j, Linkurious, derivo GmbH, Graphileon, S-cubed, Helomics as well as several volunteers to set up the COVID-19 graph database, which connects data from a range of well established public sources and links them in a searchable database.
The initiative is starting to help researchers and scientists find their way through the 51,000-plus publications on the disease and related disease areas such as SARS, over 32,000 relevant patents, and allow them to query data on a gene or protein, clinical trial, drug and create hypotheses. While researchers know a lot of data about genes, proteins and other entities in their particular field, they are normally not aware of other related research in other fields, and no one can read that many papers and assimilate all that information, especially if we want to create effective COVID-19 regimes and get to a vaccine as quickly as possible.
The database allows us to structure this data and to connect it to the fundamental things from biology — genes, the proteins and their functions. It’s not so easy to find that information in different databases, because usually you have to carry out searches on the patent database, the publication database and the gene database, and then make the connections. Usually researchers are creating Excel sheets, a list of identifiers and then they go to the database and then type in these identifiers, to get further information. But this yields limited results because of the lack of connections and is labour intensive, error prone, extremely inefficient and slow.
We have also just added a clinical trials database, providing information on the kinds of COVID-19 clinical trials available, making clear typical inclusion criteria like is there a specific population that is tested for this clinical trial, such as people under a certain age or a risk group, like diabetic patients? This is valuable information that is usually scattered across different databases, and now we can bring it together and link it with everything else.
Why graph technology?
Our first encounter with graph technology at DZD was sparked by a need three years ago to create a metadata repository of expertise and experts across not just the DZD but also related centres, a task that encompassed 500 researchers and 10 university hospitals spread across Germany.
It was obvious that everything we wanted to be able to look at was connected, but heterogeneous on a data level, and that graph technology would be the way to tackle it. We worked with our graph database technology partner on this and on the coronavirus project, Neo4j, to create an internal tool called DZDconnect which sits as a layer over relational databases linking different DZD systems and data feeds.
A significant early insight: ACE2
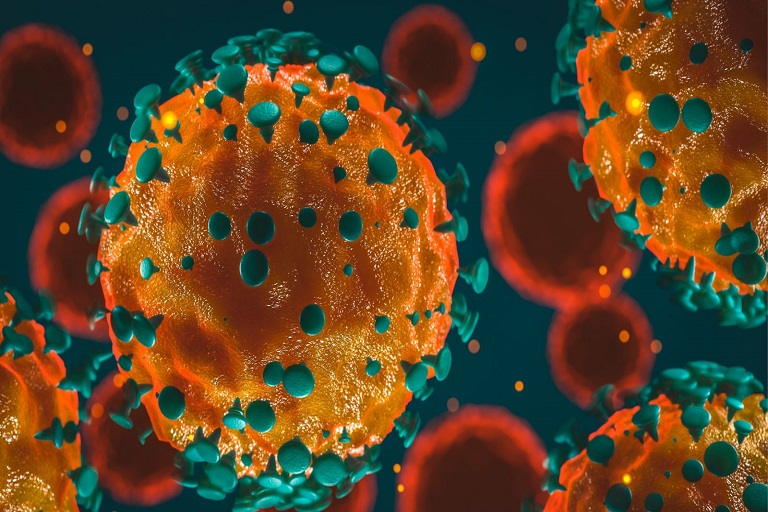
An early breakthrough is around ACE2, the host cell receptor responsible for mediating infection by SARS-CoV-2, the novel coronavirus responsible for COVID-19. Interestingly, one might assume that the receptor ACE2 is just active lung tissue, because one of the most vulnerable groups is the one with lung disease, but it turns out that of 55 tissues around the body, the receptor is active in 53 of them, which means this receptor is active in almost every tissue of your body. So any vaccine will need to be able to fight the virus in all these different tissue areas.
If you are already researching COVID-19, you’ll know that ACE2 is very relevant, but the majority of researchers do not know these very specific details our research show. Surfacing details like this via our use of data will, we hope, prove very useful in the race to find a vaccine.
Source: https://www.healthcareitnews.com/blog/europe/using-graphs-develop-deeper-understanding-covid-19

