


The study utilized a dataset comprising deidentified structured medical records from approximately 1.28 million patients across three healthcare institutions under the Singapore Health Services (SingHealth) cluster. This dataset covered a 3-year period from January 1, 2018, to March 1, 2022, and included the National Heart Centre Singapore, KK Women’s and Children’s Hospital, and Singapore General Hospital. The research adhered to relevant guidelines and regulations, receiving approval from the SingHealth Data Governance committee, with the SingHealth Centralised Institutional Review Board waiving the need for informed consent.
Data extraction involved collecting information from diverse sources within the SingHealth Database, such as laboratory results, radiology reports, pathology records, diagnoses, and detailed patient information. To mitigate privacy risks, only structured data was extracted initially, excluding free-text fields. Sensitive data fields were pseudonymized based on the “SingHealth Policy for Data Anonymisation” through a trusted third party. The pseudonymized data were then transferred to the Office of Insights and Analytics High-Performance Computer Lab, ensuring strict security measures to restrict access to authorized personnel only.
Post-deidentification, the structured data underwent normalization and standardization using the Population Builder tool, a third-party platform. Value sets in Population Builder facilitated grouping codes related to the same disease/phenotype, streamlining the filtering process. Two rare diseases, Fabry Disease and Familial Hypercholesterolemia (FH), were selected for the pilot project due to well-defined diagnostic criteria and extractable data from health records.
The diagnostic criteria for Fabry Disease and FH were outlined, and value sets were created to identify patients with known diagnoses. Data wrangling involved specific metrics examination for each patient cohort, retrieving relevant data using SQL queries, and subsequent manipulation in RStudio for analysis.
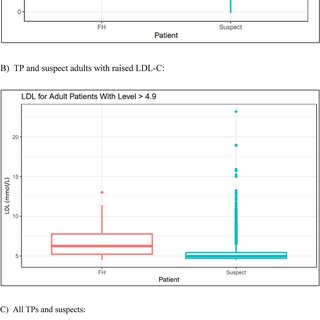
Data analysis encompassed visualization and statistical testing. The tidyverse and lubridate R packages were employed for visualizing demographic data through pie charts, scatterplots, boxplots, bar graphs, and a Venn diagram. Statistical testing involved a two-sample t-test to assess the difference in mean LDL-C levels between FH True Positives (TP) and suspects.
In summary, the study employed rigorous methods for data extraction, deidentification, and analysis, aiming to identify undiagnosed patients with rare genetic diseases through cluster analysis and visualization of electronic health records data.